
A tale of two states
"It was the best of times, it was the worst of times, it was the age of wisdom, it was the age of foolishness..."A Tale of Two Cities, by Charles Dickens

If like me, your social media feed is full of climate-related click bait, you’ll see that about half trumpet some new innovation that will save humanity, and the other half dismiss the progress we have already made with no mention of a possible replacement.
Biofuels have long been controversial. In this edition of The Climate for Change we examine whether biofuels represent wisdom or foolishness in the context of two states that produce a lot of ethanol.
The critique of biofuels is not so much about the carbon dioxide (CO2) emissions at the tailpipe that are considered part of the natural carbon cycle. Rather the focus is more on the CO2 produced by the input energy to produce the biofuels. While the industrial energy-related CO2 emissions released to produce biofuels is not enough to be really noticeable at the national level, it is a significant influence on the energy-related CO2 of the states that are large biofuels producers.
The top ethanol producing state is Iowa and the second largest producer is Nebraska. With Iowa producing 25% and Nebraska 13%, together they are responsible for almost 40% of U.S. ethanol production. (1,2)
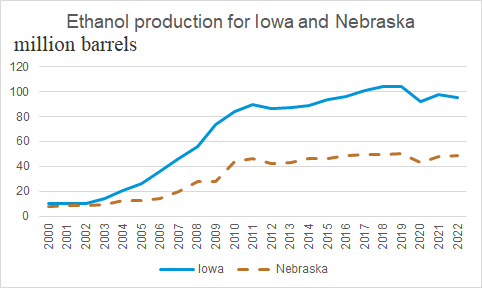
Source: U.S. Energy Information Administration, State Energy Data System
These two states have energy and emissions profiles that reflect their use of energy to grow corn and then to produce ethanol. Both the growing of corn and ethanol production are considered industrial energy use by the U.S. Energy Information Administration (EIA). Iowa’s industrial sector consumed about 55% of its total energy and Nebraska 47% in 2022. (1,2) Of course there are other agricultural products produced by these states, but ethanol production plays a big role in the energy used.
One of the controversial aspects of ethanol production is the energy balance. There was a time when the energy contained in ethanol was less than the amount of energy required to produce it. In recent years that appears to have changed as the production process has become more efficient and recent estimates put the energy in ethanol at least 30% more than the input energy. (3)
As Dr. Michael Wang of Argonne National Laboratory has pointed out, by-products are crucial in determining the energy balance. (4) Distillers grain is high in fats and protein and makes a good animal feed supplement. But the energy balance argument can sometimes be deceiving. For example, in the production of electricity, the amount of input energy from fossil fuels exceeds the output energy. An efficient natural gas electricity generator can have a heat rate of 6,400 British thermal units (Btu) per kilowatthour of electricity, but a kilowatthour of electricity has an energy value of 3,412 Btu. While this is a negative energy balance, the electricity produced by it is a unique form of energy that doesn’t have ready substitutes. So, if we are looking for a carbon neutral transportation fuel, the energy to produce that fuel is not as important as the embodied carbon in that fuel.
In terms of energy intensity, as measured in thousand Btu per chained 2012-dollar (Btu/$GDP), Iowa’s level was 8,700 Btu/$GDP and Nebraska’s 7,400 Btu/$GDP in 2021. The national average is 5,000 Btu/$GDP. Using both the energy per capita and energy per $GDP measure, Iowa would be considered a more energy-intensive state when taking into account the state’s population and level of economic activity.
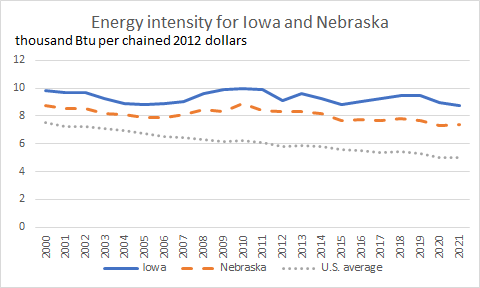
Source: State Carbon Dioxide Emissions Data - U.S. Energy Information Administration (EIA)
However, when it comes to measuring the output of CO2 based on population and energy consumption, there is a different story. In 2021 Iowa produced 22.9 metric tons (mt) CO2 per capita while Nebraska produced 24.0 mt CO2 per capita. Given that Iowa is a larger energy consumer one could reasonably ask why this is the case. For the first decade of the 21st century Iowa’s per capita carbon emissions exceeded those of Nebraska. As recently as 2008 they were 15% greater than Nebraska’s per capita CO2 emissions. By 2011 the two states were about the same and since then Iowa’s per capita levels have been lower than Nebraska’s. What is especially significant is that this is when Iowa’s ethanol production began exceeding 80 million barrels per year and headed towards 100 million.
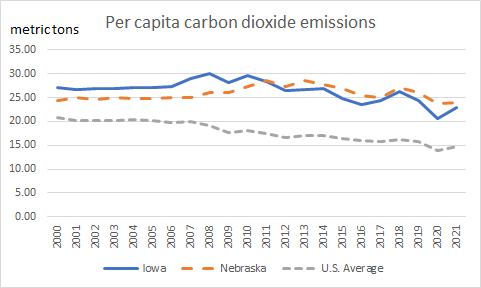
Source: State Carbon Dioxide Emissions Data - U.S. Energy Information Administration (EIA)
Both states are above the national average for CO2 per capita, but as we will see, that is based more on energy consumption than the carbon intensity of that consumption.
Both states have been near the national average for CO2/Btu of 50.2 kilograms of CO2 per MMBtu, but Iowa has improved its position in recent years. In 2002 Iowa’s carbon intensity was 14% above Nebraska’s but by 2009 they were about even. In 2021 Iowa’s carbon intensity was 13% below Nebraska’s level and below the national average. So, what has happened to produce this change?
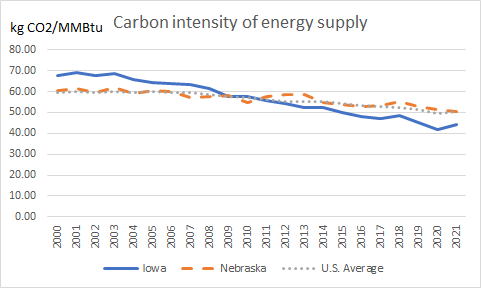
Source: State Carbon Dioxide Emissions Data - U.S. Energy Information Administration (EIA)
Coal is the most carbon-intensive of the major fossil fuels and historically it has been a large component of electric power generation and industrial energy. In 2000 Iowa consumed twice the amount of coal as Nebraska. By 2019 Iowa consumed about the same amount of coal as Nebraska and it has remained that way.

Source: U.S. Energy Information Administration, State Energy Data System
Much of the decline in coal consumption was as a fuel for electricity generation. The decline in Iowa’s coal generation has been accompanied by an increase in wind generation. In 2010 Iowa produced nine terawatthours from wind and Nebraska produced 0.4. By 2015 Iowa produced about 18 terawatthours and Nebraska three terawatthours. In 2022 it was close to 46 terawatthours in Iowa and almost 13 terawatthours in Nebraska. In 2023, Iowa’s wind turbines produced 59% of its electricity—the largest percentage in the United States. (1)
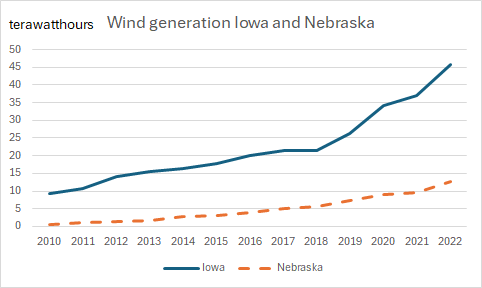
Source: U.S. Energy Information Administration, State Energy Data System
As wind generation began to take a larger share of Iowa’s electricity production, the carbon intensity of the state’s energy profile began declining faster than Nebraska. In 2000 Iowa’s carbon intensity was 12% greater than Nebraska’s. After 2011 Iowa’s carbon intensity of its energy consumed was consistently below that of Nebraska. In 2021 it was 13% below Nebraska’s carbon intensity. In terms of the electric power sector itself, Iowa’s carbon intensity is 789 pounds per megawatthour (lbs./MWh) while Nebraska’s is 1,199 lbs./MWh as measured in 2021. The U.S. average is 858 lbs./MWh. (5)
As a reflection of the input energy for growing crops and producing biofuels, both states have higher energy intensities than the national average. However, Iowa has shown that by increasing their reliance on wind they have reduced their overall state carbon intensity to below the national average. If biofuels are to play a role in carbon-neutral energy, producing states must make a continued effort at reducing the carbon intensity of the direct inputs to produce the fuel, or they must offset those inputs with increased reliance on non-carbon energy sources elsewhere in their states.
Ultimately the role of biofuels in the energy transition of transportation fuels should depend on their cost and effectiveness in competing with other energy sources such as electric vehicles (EVs). The so-called blend wall limit on the percentage of ethanol in motor gasoline is 10%-15%. If longer term goals in carbon reductions are to be met, this would require a much greater percentage of blended ethanol. There is debate as to how stringent the blend wall needs to be. Other biofuels, such as renewable diesel, do not have blend wall constraints but have other limitations in production and cost.
Both states have ample wind resources. It may be that the direct use of wind and solar energy to produce electricity for EVs is the more effective use of each state’s energy resources. However, how this plays out will likely be the product of more than just pure economics as there are large financial interests with billions of dollars at stake. The dynamics of political power will largely determine if these are times of wisdom or foolishness.
Sources
4 Corn-Based Ethanol Does Indeed Achieve Energy Benefits
5 State electricity profile Iowa, Nebraska, and the U.S. average carbon intensity of electricity
Interesting post, thanks, Perry.
You started by saying "In this edition of The Climate for Change we examine whether biofuels represent wisdom or foolishness in the context of two states that produce a lot of ethanol." My takeaway from this is that, regardless of the wisdom/foolishness of producing ethanol, the faster that we decarbonize the electric power sector, the faster overall carbon intensity decreases, especially for energy-intensive processes where electricity is a key input (like biofuel production). I suppose a corollary is that, from a GHG standpoint, subsidies for biofuels may only make sense where the carbon intensity of electricity is low.